This blog started with my Phyloinformatics course taught in University of Glasgow.. now I've been publishing other stuff that I do in my MSc and any interesting Bubble I find on the web. Enjoy! :)
Wednesday, 21 March 2012
MindGenius Mind Mapping Software
This is Genius!!!
I wish I had explore that earlier... It looks like a really good software for brainstorming and capturing ideas and later presenting them.
I will keep it for a further reference.. it looks like it will be very useful for my project.
I could have been useful for my phylogenetic trees for my phyloinformatics project...oh well..when I use the free trial, I will add a comment on it..but other comments on the program are also accepted. :)
Monday, 12 March 2012
NCBI_Blast_Tree
The process of making a phylogenetic tree is simple in essence, however in our case, where we had to deal with many new species; to make a proper molecular tree would be a challenge. The basic steps involved in creating a tree from molecular sequence data are:
(i) Some collection of sequences obtained from the NCBI database by a BLAST search and (carefully) aligned to put together homologous residues, nucleobases, or amino acids in case we want to compare proteins.
(ii) Identifying other sequences that are related to the sequence of interest and obtain the data for that sequence is also a crucial step.
(iii) Aligning the sequences and finding the differences between all pairs of sequences would be our next step, we would use ClustalX in order to accomplish that step.
(iv) Using the alignment results, we can generate a phylogenetic tree.
(source: "Phylogenetic Trees Made Easy - A How-To Manual for molecular Biologists" - Hall G. Barry)
Our first step was to Refine our data table and find the NCBI codes for each specie.
Filtering our data for all the species that have a NCBI code.
As we can see, most of the species did not include a valid NCBI ID code, since they are still new species. Another reason could be because of a spelling mistake in their scientific name, are because the same specie could be know with another scientific name, causing a confusion. While filtering the data, we got only 100 species that contained NCBI ID number, out of 328 species in the list. And only 70 species had both NCBI and uBio ID names.
I've decided then to look in NCBI Taxonomy database for a small group of new mammals and compare them and try to make a good molecular tree for this small group.
Unfortunately it was very hard to find sequences of the same protein or molecule in each of the species and then make a sequence alignment with ClustalX.
.....
The best tree I could manage to find is a typical tree in NCBI, where I used the NCBI codes that I had produced in Google Refined table.
NCBI Tree
In our Data, only 169 species appeared with NCBI codes and these came out to our Taxonomy Tree in NCBI. Dominic and I tried to save the file in different available formats. Unfortunately, we do not know how to open this file after we save it. We tried using PHYLIP, since Dominic used that while attempting to make a tree, but it didn't work for some reason.
Saturday, 10 March 2012
Errors...
I have downloaded and tried many of the programs I found in this page.. Even though I was hoping to work with TreeView and figure things out.. Treeview wasn't very friendly to me. I tried to follow the instructions given in the manual and while I was trying to make a taxon list and load it to the program, I would always get an error for some reason. I also tried to paste a nexus script example, but still wasn't working. I uninstalled the program and installed it back again...nothing. So, I gave up and looked for something else.
Then I worked a bit with NDE, but I couldn't really understand what was it producing.
Ahhh... ok lets take it from the start. I am forgetting what I have done in the first place while I search stuff, get lost from one link to another, stick on errors and then can't remember where I began from.
First step: BLASTING the Cricetidae family.. We're getting a good looking result, but it's not what we need..I feel lost, need to revise my course notes again.
Trees trees trees..
My friend Dominic has done a really good job on trying to create a KLM tree using Nexus, just like we learned in our Phyloinformatics course, our problem is that we should give our tree some dimensions in space. So I decided to play a little with the content of the data.. I chose to work with one family of species, the one that we have the most species on. so I filtered our table in order to show only the order Rodentia and the family of Cricetidae.
First I've tried to see if the iphylo Mashup could give me some information...but, unfortunately, no luck in getting a tree from TreeBase.
so then I though...ok I'll look in NCBI: and found the Taxonomy ID: 9989 for Rodentia and then found the
uBio classification of Rodentia
but no further information about our new species.
Blasting the ID code also gave me a tree, but I could not associate it with our data.
Then I repeated the search in NCBI while doing a Cricetidae search. This time I think I got better results for the Taxonomy ID: 337677.
and I can also download a csv file for that one. I will need to try and figure out how can I match those results into our "New mammal Data" and merge that into a nexus file to make a KLM 3D Google Earth tree.
...Interestingly enough, there are soooo many ways to create a phylogeny trees. HERE is a list of programs that can be used. I will experiment and try to make a tree by using TreeView.
Friday, 9 March 2012
Google refine
I've tried to refine the data and find the existing codes for each of the new species...The source I used is uBio FindIT - http://iphylo.org/~rpage/phyloinformatics/services/reconciliation_ubio.php, as suggested by our professor in our Phyloinformatics course. So I've updated the table that we are going to work with. Hopefully this will let us create a phylogenetic tree for some of the species. Unfortunately, the number of species without an ID code are still many:
This pie chart shows the percentage of the new mammal species that are still without a unique ID: 57.9%. In our report we will analyze the importance of globally unique identifiers for species.
Thursday, 8 March 2012
Data mining for our tree..
Dom and I, we have extracted all our information from our pdf paper into a csv file, however is seems like we're getting errors while following some steps... we're working on it...
...next step...google refining and working on the NEXUS code...
Google Earthing...
Dom and I, we created a KLM file and this is our result in Google Earth :)
The red dots appearing in our map are representing our new mammal species since 1992 (source). They are not very clear in the video but, we can see that in certain areas (especially islands) there are many new species found.
Once we have our data extracted..It is time to make a 3D Phylo-Tree!! :)
Wednesday, 7 March 2012
Hmmm...why hadn't I seen this option earlier?..
Testing if the graph's visuals work..
The graph is showing the number of new mammal species that were found in each order, since 1992.
Aggregating by family:
More and more web pages and data...
I keep getting lost into new web pages...they all seem like they have loads of useful specie distribution related information, but I need so much time to look through them... I'll just bookmark them here for now and hopefully I will find the time to review the information until Friday..
NBN Gateway
and
BioMar
Tuesday, 6 March 2012
From Environmental Stats to Species Modelling...
I've almost managed to understand how a statistical prediction model works due to my Environmental Statistics report...pretty cool...but I can work on it only by giving me the R commands already in order...hehe...I'm not really a math major... so I'd rather just dive in the sea and look at all the strange species that live in there...
However, once I've been managing to understand a bit about modelling and how well they can be used in different future predictions, I might connect that with our phyloinfromatics project and try to answer the question of: "How many new species will there be discovered in the next decade?"
The following graph, provided in the paper of Reeder et al. (2007) shows us the cumulative and decadal descriptions of taxonomically valid extant mammal species. It is a time series graph with some predictions in the number of species that could be discovered in the following decade. Potential taxonomic biases were calculated by the observed number of new species with the number of new species that we would expect. As seen in the graph, the trend in new species discoveries is increasing during time. Reeder et al. (2007) supports that these trends towards to new discovery description and redescription will continue, hence we expect at least 300 new species to be described in the next decade.
(Source: D.M. Reeder, K.M. Helgen & D.E. Wilson (2007) "Global Trends and Biases in New Mammal Species Discoveries")
Friday, 2 March 2012
Random stuff...
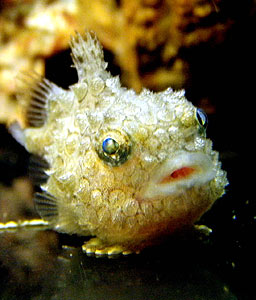
I have not forgotten about my phyloinformatics project... I really want to do it and everything keeps coming in my way...boring stats report and case study vs. dissertation research and excitement ... well... searching for my possible dissertation lab mate - the Lumpsucker, I ran into this blog that also has some possibly interesting Taxonomy links that I should explore.. one of them seems really interesting... The Barcode of Life Data Systems (BOLD)
I'll be exploring more with my friend Dom very soon.. Good night blog world..
Subscribe to:
Comments (Atom)


